Before we address the surprising announcement by NASA scientist Martin Mlynczak, late last year, that the Earth’s upper atmosphere is cooling, it is important to understand the data manipulation that has been going on for many years by both NASA and the National Oceanographic and Atmospheric Administration (NOAA).
As can be seen by the following graph, the Earth’s surface temperature appears to track reasonably well with the increases in carbon dioxide (CO2) levels in recent decades.
However, much of the underlying temperature data has been continuously manipulated by NASA and NOAA to bolster concerns about man-made climate change.
For years, climate activists in charge at NOAA and NASA were surprised that their own data and satellite measurements had been showing the climate to be stable or cooling since 1998 while CO2 levels had continued to rise. They were under intense pressure to explain how this could be happening in the face of the alarmist reports put out by the United Nations Intergovernmental Panel on Climate Change.
It was clearly time to resort to the strategy that progressives use in times of crisis: if you do not like the facts, ignore them and create your own, in accord with George Orwell’s famous novel 1984. Such an approach has been followed by tyrannical leaders down through the ages.
The publication Frontiers of Freedom in their February 23, 2016 issue documented what has been done in an article by Thomas Richard titled “How NOAA Rewrote Climate Data to Hide Global Warming Pause.”
The falsification of climate data by NOAA and NASA covers more than just the past decade. The U.S. has published temperature data beginning in 1880 up to the present. Climate realist blogger Tony Heller shows how their data has been tinkered with many times in past years, in “The History of NASA/NOAA Temperature Corruption.”
Below we show a graph (extracted with permission of the publisher from The Mythology of Global Warming, by Dr. Bruce Bunker (2018)) of the NASA average temperature data across the U.S. starting in 1880 posted in 1999. Directly below on the same chart is the data NASA posted for the very same years in 2016 after government manipulation of what was presumably generated from the same underlying data set.
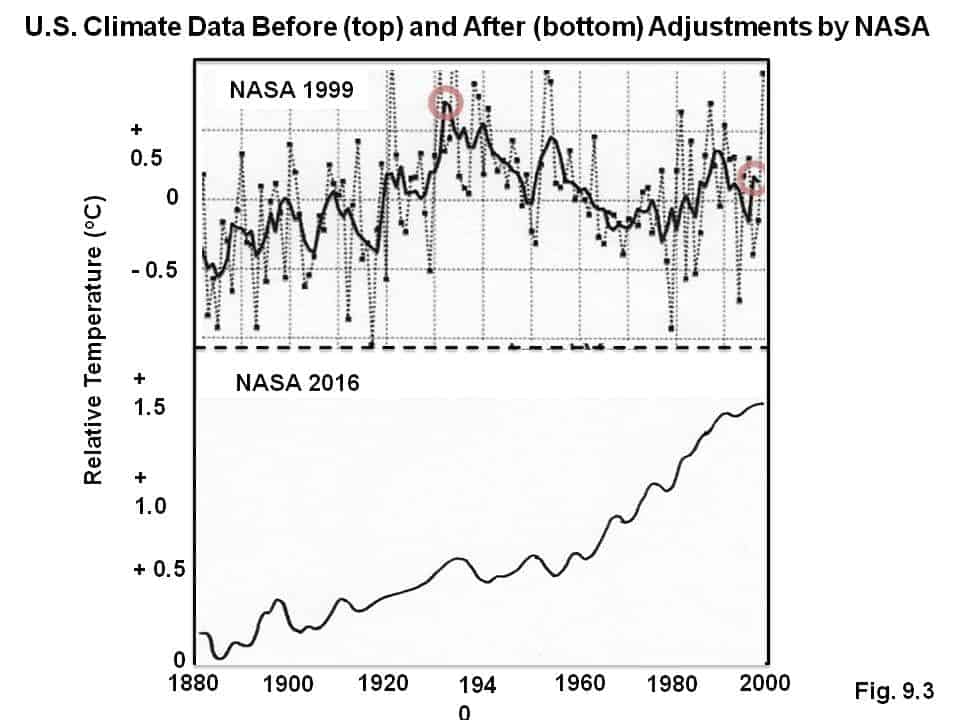
This obvious alteration of reality should be an embarrassment to NASA. It has not gone unnoticed.
Perhaps not surprisingly, the climate curve recalculated in 2016 is now in agreement with the global warming movement. The cooling trend between 1940 and 1970 that led climate alarmists to warn that fossil fuel emissions were plunging the Earth into another Ice Age has been largely eliminated. The data now show that temperatures are increasing exponentially along with rising CO2. The new curve shows the Earth’s temperature increased 1.4 degrees Celsius since 1880. Temperatures that are out of line with the prediction of alarmists are gradually and systematically adjusted and replaced by ‘corrected’ computer-generated temperatures. Children who are fed this new data are being recruited to beg us to save their futures.
Dr. Bunker explained what has happened in the case of NOAA data:
“Rep. Lamar Smith (R-Texas), who runs [prior to the 2018 election] the House of Representatives Science and Technology committee, has demanded that NOAA produce their data for independent analysis. NOAA has refused to release the subpoenaed documents. Judicial Watch has sued NOAA under the Freedom of Information Act to obtain access to their data. NOAA continues to refuse to turn over the documents.”
The new truth seeping out from NASA was first reported in the New American magazine by James Murphy in October 2018 where he quoted Martin Mlynczak of NASA’s Langley Research Center, saying:
“High above Earth’s surface, near the edge of space, our atmosphere is losing heat energy. If current trends continue, it could soon set a Space Age record for cold.”
Major media outlets completely ignored this information.
This new revelation comes from NASA’s SABER instrument aboard NASA’s TIMED satellite. SABER stands for Sounding of the Atmosphere using Broadband Emission Radiometry and TIMED stands for the Thermosphere Ionosphere Mesosphere Energetics and Dynamics.
SABER monitors infrared radiation (i.e., heat) from CO2 and nitrous oxide (NO) molecules which are two of the gases that play a major role in releasing energy from the thermosphere (which starts at 50 miles altitude) at the top of our atmosphere. Mlynczak, who is the associate principal investigator for SABER, added,
“the thermosphere always cools off during Solar Minimums. It’s one of the most important ways the solar cycle effects our planet”.
Solar Minimums are time frames when the Sun is less active and so releases less radiation toward the Earth.
Mlynczak invented the Thermosphere Climate Index (TCI) as a measure of the rate of energy release (in Watts) that NO molecules emit into space from the thermosphere. The following graph shows TCI dropping as we move into the current Solar Minimum. TCI values are approaching the lowest ever since measurements began.
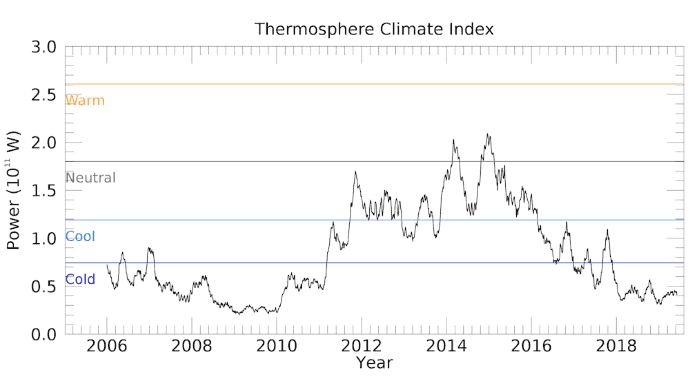
Murphy reminds us about the forecasts of a Grand Solar Minimum in the coming decades, similar to the Maunder Minimum of the mid-17th to early 18th centuries, which coincided with the Little Ice Age, when temperatures were much lower than those of today. He concludes,
“All any of this proves is that we have at best a cursory understanding of Earth’s incredibly complex climate system. So when mainstream media and carbon credit salesman Al Gore breathlessly warn you that we must do something about climate change, it’s alright to step back, take a deep breath, and realize that we don’t have the knowledge, skill or resources to have much effect on the Earth’s climate.”
Yet, Democrats and misguided Republican politicians want us to invest trillions of dollars to completely revamp the way in which we generate energy to supposedly save the climate. Talk about insanity.
(graphs source: http://climate4you.com/)
Image: Photo NASA
Image: Photo NASA
About
No comments:
Post a Comment